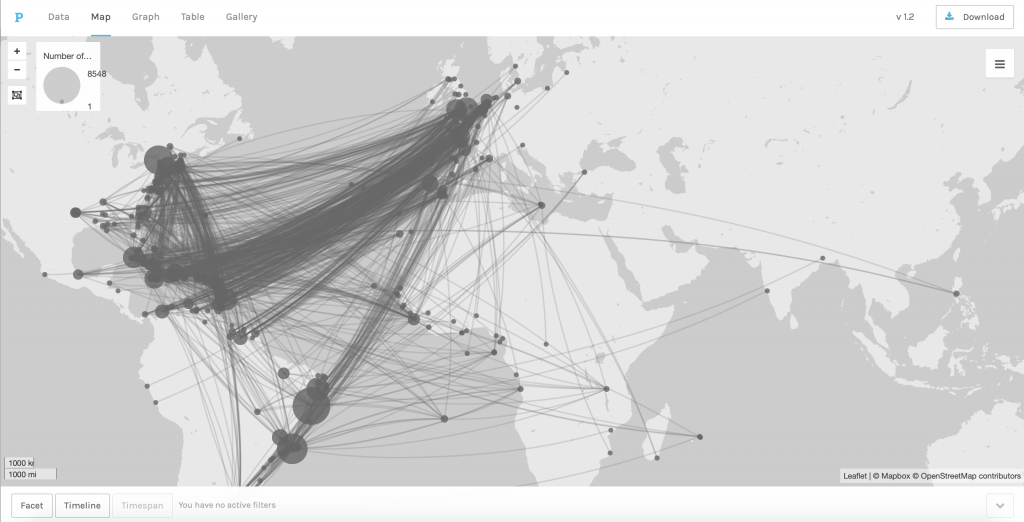
I used the data in the Trans-Atlantic Slave Database to map the numerous voyages taken across the world in Palladio. The first visualization shows the 8548 recorded voyages and plots each one of them using the LatLong of the original port and the LatLong of the location where the slaves landed. I was able to get a general idea of popular ports because of the size of the bubbles on the map, but I found the visualization to be a bit overwhelming. I decided to focus in on a specific vessel, the Mary, because it was the ship with the most recorded number of voyages.
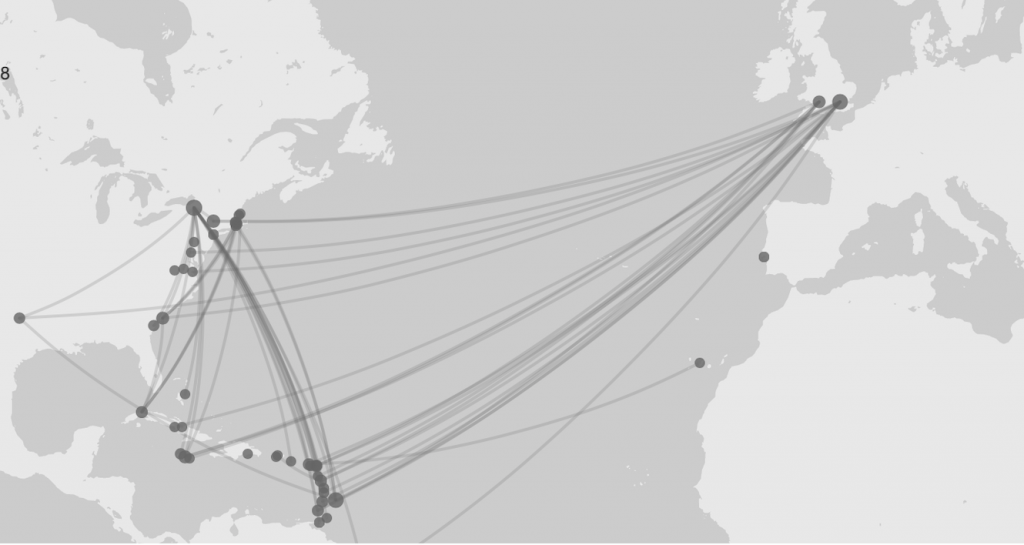
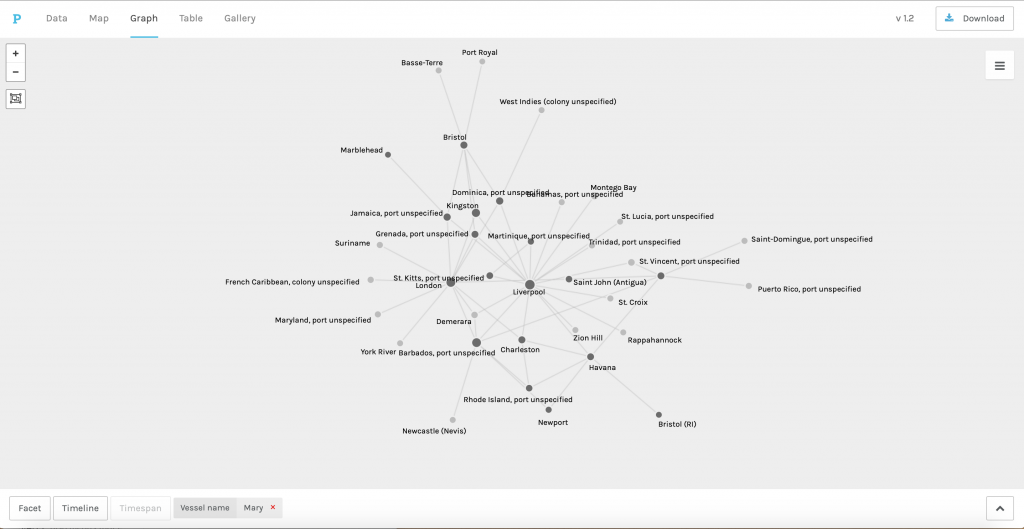
When I was able to filter it down just to the Mary, I got a better understanding of the locations that the ship went. I found the “graph” feature in Palladio extremely useful in helping me see the most visited ports. I used the highlight feature to differentiate the ports of origin from the port that the slaves landed at. I became particularly interested in Liverpool, not only because it was one of the ports that many of the voyages originated at, but it also had the most number of connections with different ports. From the lines connecting the nodes in the visualization and the spatial layout of this particular visualization, I was able to infer that Liverpool served as a hub in the Trans-Atlantic slave trade. I continued to explore the Mary in Palladio.
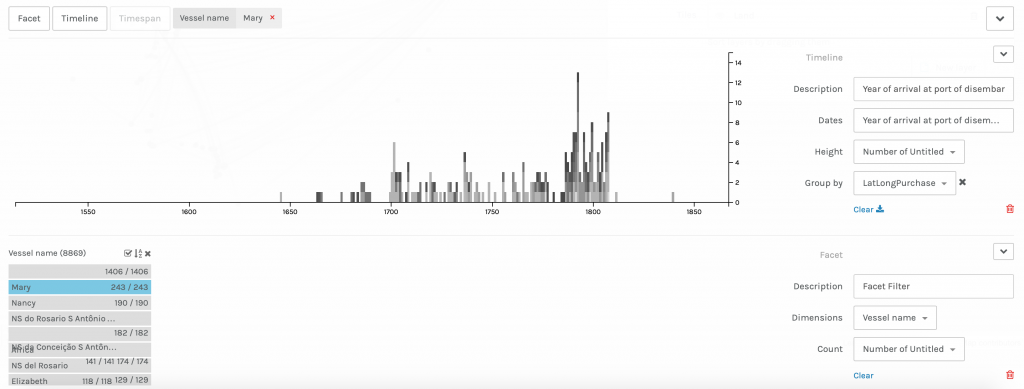
The “timeline” feature on Palladio was really beneficial for me to see when the Mary took its first recorded voyage, its last recorded voyage, and the most number of voyages. The height of the bars on the timeline shows me the number of recorded voyages each year. I was particularly interested in the years right before 1800 because there was a huge surge in the number of voyages it went on and the year 1807 because there was a dramatic stop in the number of voyages following that year.
Palladio allowed me to be what Johanna Drucker refers to as a “knowledge generator.” I was able to take a large set of data and filter it to display the results I wanted and answer the questions I had. I was able to narrow in on a specific vessel and see where it went and when it went to these locations. The platform allowed me to manipulate the data that I had to produce the answers I needed. I then was able to relate what I learned about the Mary to what was going on in society at the time. Through Palladio, I learned that Liverpool, specifically in the years right before and after 1800, had an extremely important role in the Trans-Atlantic slave trade. However, I wanted to learn more about this, so I did contextual research on the port in Liverpool around the beginning of the nineteenth century and was able to discover more.
I discovered that Liverpool was a location that many slave voyages occurred from. The port was in a prime location because it had easy access to a network of rivers. It is estimated that “Liverpool ships transported half of the 3 million Africans carried across the Atlantic by British slavers” (International Slavery Museum). This helps to explain the significance of Liverpool as it relates to the Mary. The immediate end to the Mary’s voyages can be explained by the fact that the United Kingdom passed a bill abolishing slave trade in 1807 (The National Archives). Timeline.js allowed me to build on my findings on the Mary, which I discovered in Palladio, and relate them to the overall Trans-Atlantic slave trade in an interactive and educating manner.
