I began with the African names database in Palladio to examine the network of a particular name, Quashie, along with versions of that name, including different spellings and “qua” sounds to see how the name developed through time. I am interested in exploring data related to what my final project may include and Kei Miller’s “Quashie’s Verse” is a poem I imagine using as a data source. Only having an idea of what the name signifies in the Jamaican context, seeing it appear in the database sparked my interest in understanding how the name developed during the period of enslavement.
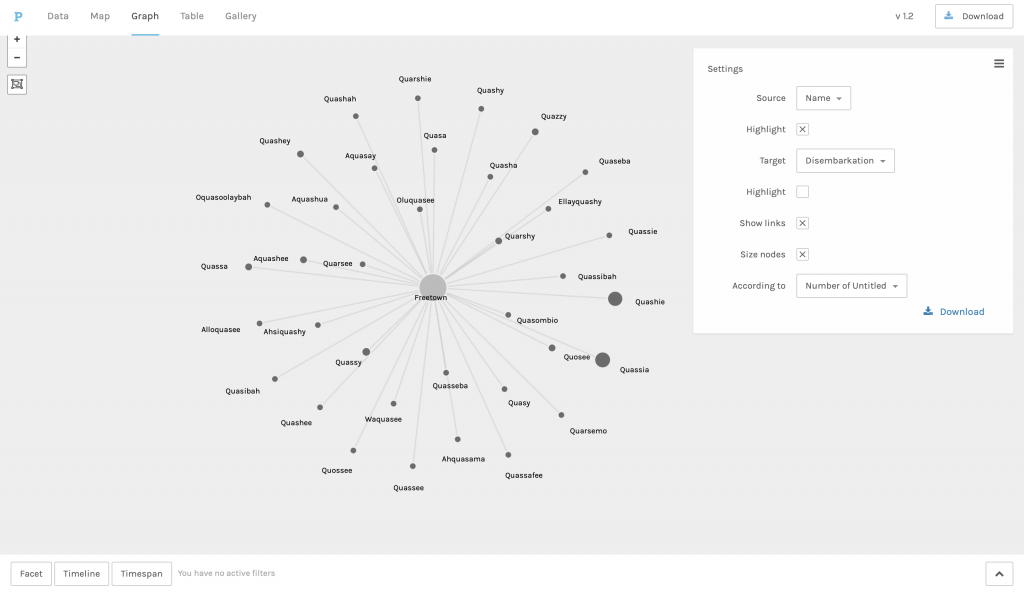
The graph function in Palladio supports the visualization of the relations between Quashie and iterations of the name through time, using embarkation and disembarkation as those temporal boundaries. In order to make these relationships legible I did some data plumbing, extracting the names that have a phonetic similarity to Quashie before loading it to Palladio. The hidden pattern then emerged from the larger database, all the iterations of Quashie, some spelled Quashee, Quarshy, Quarsee Quashy, to name a few. Others seemed to be derived from Quashie, like Aquasay and Ahquasama, or feminine versions of the presumably masculine name.
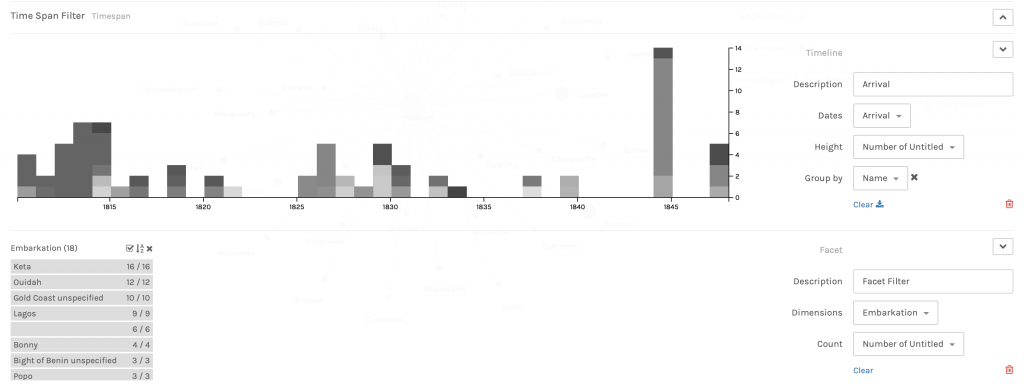
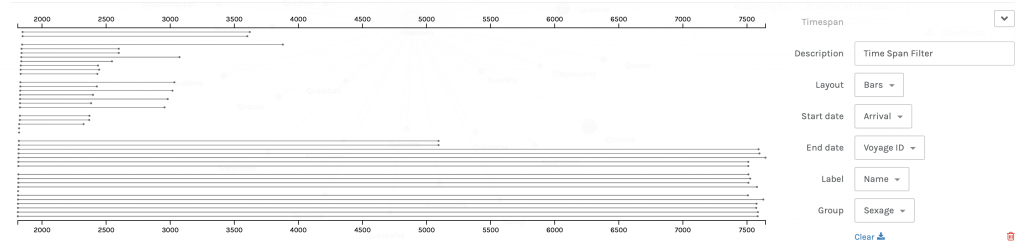
The timeline and timespan features reveal new knowledge, notably the frequency in the documentation of the name Quasia, and then that of Quashie from 1810-1850. The network graph, timeline and timespan allow for multidimensional interaction between visualizations of the data. For example, the Time span filter to group the names by sex, demonstrating that some names were attributed to both men and women.
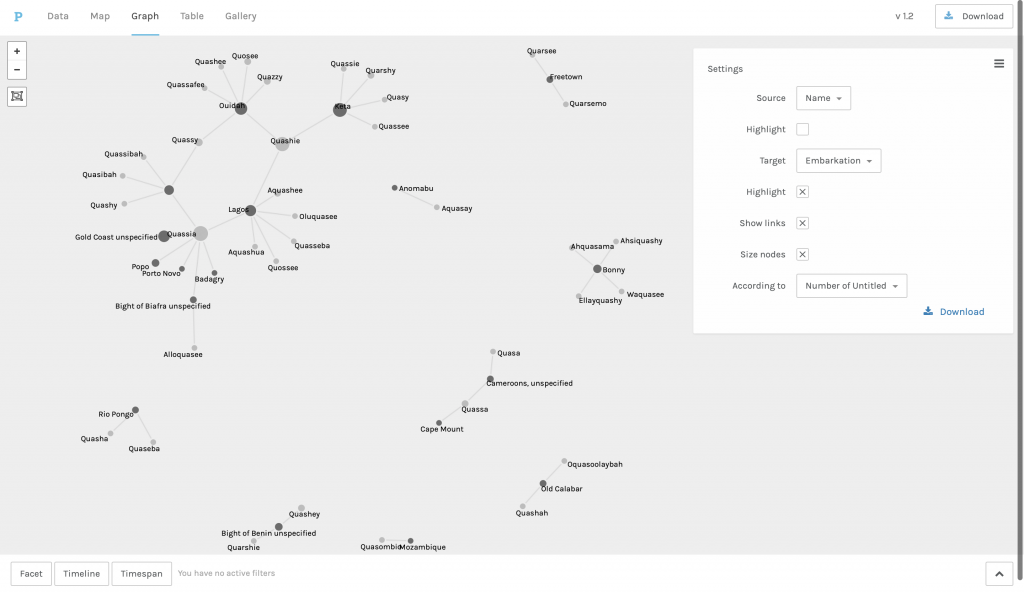
Furthermore, by reorganizing the data in the network using embarkation in contrast with disembarkation, two significantly different visuals are produced. The aesthetics of the latter implies wholeness or unity among the names with Freetown in the center, while the broken or truncated system produced by the former evokes a diverse relationship, highlighting the heterogeneity of the ‘origins’ of the names. They are not unified or homogenous, despite the similarities among names many came from different places. The image created depends on what the user prioritizes.
Thinking of these visualizations as art fosters an interesting connection with the visual or concrete poem that inspired this exploration. The idea of critically reading or examining the digital links Tanya Clement’s work with Johanna Drucker’s. In terms of Clement I did a kind of distant reading using the ‘find and replace’ tool in Excel to locate “qua” names and then doing a sort of close reading by examining the words that the program identifies to see if they fit my criteria for phonetic similarity – producing a differential reading. While Drucker’s argument about giving attention to and questioning the tools that digital humanists use, prompting an investigation into the (mis)representations produced by any visualization is made clearer not only by my extraction of the data, but also what I choose to highlight to make an argument.
In an effort to contextualize the visualizations I began with an article from David DeCamp titled “African Day-Names in Jamaica” (1967). He discusses the chronology of male and female African day-names, where “An infant born on Sunday would be named if a male, Quashé, if a female Quasheba, and so on, each sex receiving a name proper and peculiar to each day of the week according to the following table” (140). Gosse’s use of the tabular format recalls Drucker and her discussion of the mechanisms of the columnar form and its complex readings (the starting point for the Palladio and the Timeline JS visualizations). One reading I offer is that by beginning with Sunday and ending with Saturday Gosse adopts or reifies a particular conception of time – that it has a direction. It may even present a hierarchization of the names, despite Drucker’s claim that “grid forms do not express a hierarchy in their graphical systems” because DeCamp seems to take this cue and spends significant time discussing Quashie, the Sunday name (240). Using and citing “Quashie”, “Quashé” and “Quashee” throughout the article, DeCamp illustrates the indeterminacy (in spelling and meaning) of the Sunday male name. Finding phonetic versions of this name throughout the records in the African Names database was then particularly noteworthy.
DeCamp notes the scattered references to the day-names between 1774 and 1851. The end date is supported by the timeline I created in Palladio. But these dates represent the arrival to the New World, not the date of birth of the enslaved. However, the dates are significant because the names taken from court records are likely one of the earlier documentions of these names. How may have documentation practices created new names or destroyed them? What is the ‘correct’ spelling of Quashie? Who made that decision? The authority, then, given to these records implicate the visual representation of this dataset. To return to Drucker, this is an example of the “reification of mis-information” for the biases in the capta are reflected, and further distorted in the visualizations I have created – an inevitable process.
