Tuesday 8/27/19
Week One –
- Introduction to course, expectations
- WordPress setup
- What is data visualization? What is it not?
- Visit http://viz.wtf/ — Select two visualizations to discuss on Thursday
- For Thursday, read Michael Friendly, History of DataViz
Thursday 8/29/19
- What is Data Literacy? Agnes Jasinska-Data Services Specialist
- Persuasive Cartography–the ethics of visualization
- Examples of Data Viz from students
- Discuss Friendly reading
Homework
- Weekend Reading:
- Ch. 1 “Bring Back the Bodies” in Data Feminism
- Practice blog post–
- “Based on the readings you have done this week and the discussions on data that we have had in class, write a 250-300 blog post in which you argue for the importance of data literacy. Using two examples (with screenshots) from the websites viz.wtf and Persuasive Cartography discuss the uses and misuses of dataviz.
- File under category “practice”. 250-300 words. Due Sunday evening at 11.59pm.
Week Two —

Tuesday 9/3/19
- Examination of Digital Humanities Sample Book
- Homework: Read Meirelles, Chapter 1, Hierarchical Knowledge Structures, and
- Read Lima Chapter 1
Thursday 9/5/19
- Discussion of Lima, Chapter 1 and Meirelles, Chapter 1
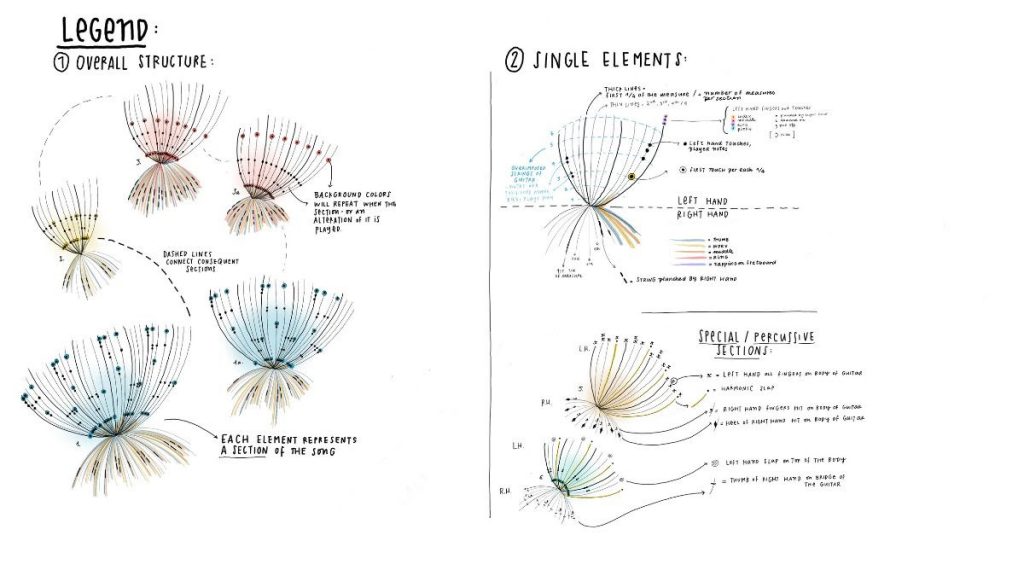
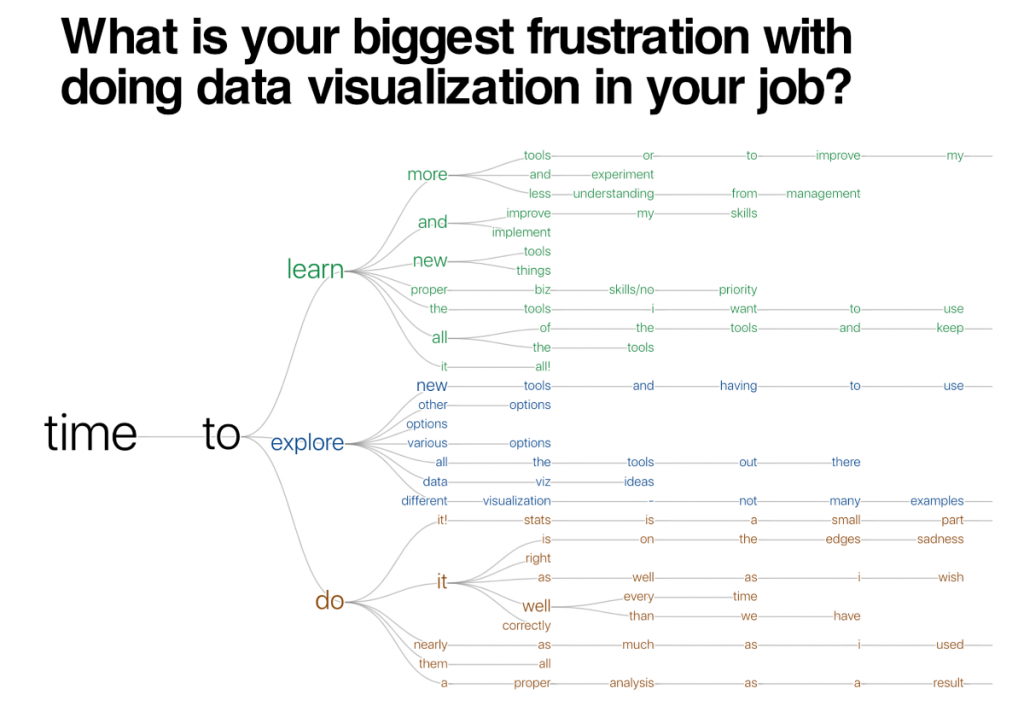
- A Typology of Data Viz: Examination of knowledge structures presented as trees; graphs; clouds
- The ethics of dataviz–the question of human experience
- How to Not Visualize Like a Racist (Data Viz Designing Across Cultures)
- Visualizing Slavery projects:
- Spread of US Slavery:
- Slave Voyages database
- Jessica Marie Johnson, “Markup Bodies: Black [Life] Studies and Slavery [Death] Studies at the Digital Crossroads”
- Hepworth & Church (2018). Racism in the Machine: Visualization Ethics in Digital Humanities Projects. Digital Humanities Quarterly.
- How to Write about Slavery. Gabrielle Foreman, et al. “Writing about Slavery/Teaching About Slavery: This Might Help” community-sourced document, accessed 8/19/19, 17.34.
Homework
- Assignment 1: due Tuesday 8 am on the website
- Read Lima, Lima Chapter 2 and Meirelles Chapter 2
- Data for next week
- Directions to install Tableau Public
Week Three — 9/10-9/12
Tuesday
Learning Tableau–Ken Flerlage, Assistant Director of Data Analytics
Thursday
- Tableau continued
Homework
- Discussions and Reading for Tuesday:
- Tanya Clement, “Text, Analysis, Data Mining, and Visualizations in Literary Scholarship” Questions for discussion
- Safiya Noble, Algorithms of Oppression: Chapter 1, “A Society, Searching”
Week Four — 9/17-9/19
Tuesday
Platforms for Data Viz: the problem with intention
The origins of the algorithm–what happens when the data viz designer/platform comes from a quantitative background and not qualitative?
Discussion of Tanya Clement and Noble
Introduction to Voyant — text visualization
For Thursday
Read Faull, Text Analysis and Visualization
Thursday
- Lab: Voyant 2.0; set up
- Stefan Sinclair’s Workshop Instructions
- Google Drive –sample .txt files for analysis
- Data Dictionary
- Introduction to Slave Narratives–https://docsouth.unc.edu/neh/intro.html
- Slave Narrative Structures
- Creating raw text files
Homework
- Assignment 2. Due Tuesday 8 am.
- Read Meirelles, Chapter 6.
Rendered by Faull, 9/21/2019
Week 5 — 9/24–9/26
Tuesday
- The Syntax of DataViz: How do we code and decode networks?
- 10 Pillars of Knowledge and the Knowledge Tree
- Library Map – Dewey Decimal Classification
- Networks. Discuss the readings
- Discuss Lima
- Mapping the Republic of Letters
Thursday
- What does a visualization suite look like when built by humanists and CS students?
- Lab: learning Palladio
- Class Outline
Homework
- Read Drucker 2016
- Explore these projects
Week Six — 10/1-10/3
Tuesday
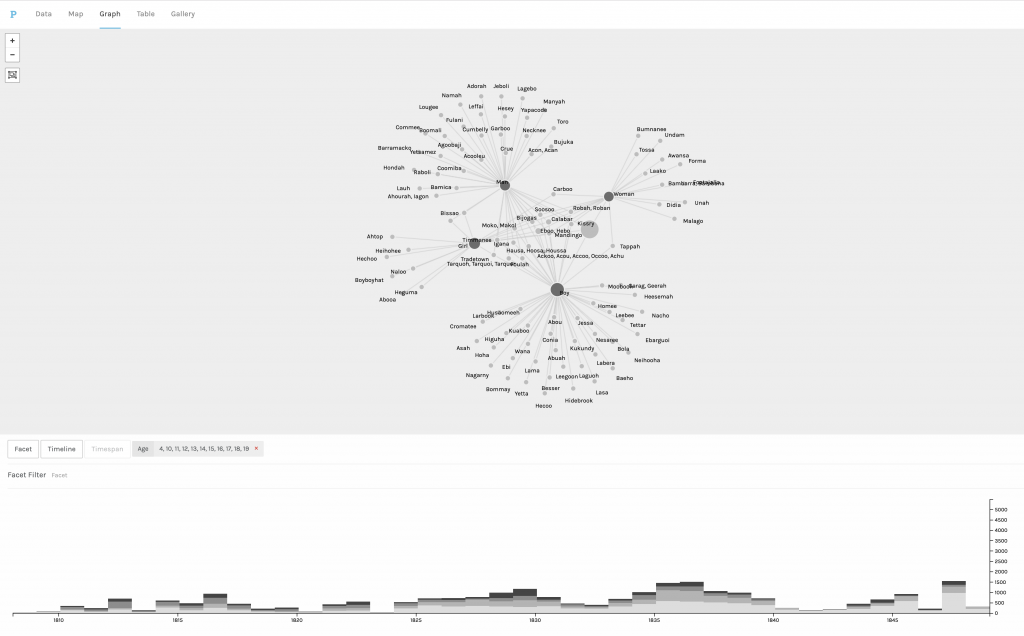
Use pre-prepared structured data (Cushman Collection from M. Posner) or: African Names database or Trans-Atlantic Slave Voyages (Carrie’s steps for working with this dataset), or Entities extracted from Fulneck Memoirs to explore Palladio.
For Thursday, read Scott Weingart on networks and Meirelles, Chapter 3 “Temporal Schemes”
Thursday
- Discuss and examine Meirelles, Chapter 3
Collect contextual research data for your project and create a timeline in:
Timeline.js-https://timeline.knightlab.com/
Helpful links:
https://researchbysubject.bucknell.edu/c.php?g=25582&p=156627
https://www.slavevoyages.org/assessment/estimates
http://www.ushistory.org/more/timeline.htm
https://www.nationalgeographic.org/interactive/slavery-united-states/ (in Timeline.js)
Read Rosenberg/Grafton, Chapter 1 Cartographies of Time
Homework
- Assignment 3: Visualize a set of literary/cultural relations
- Due Thursday, October 10, at 10am.
- Read Meirelles, Chapter 4 Spatial Studies
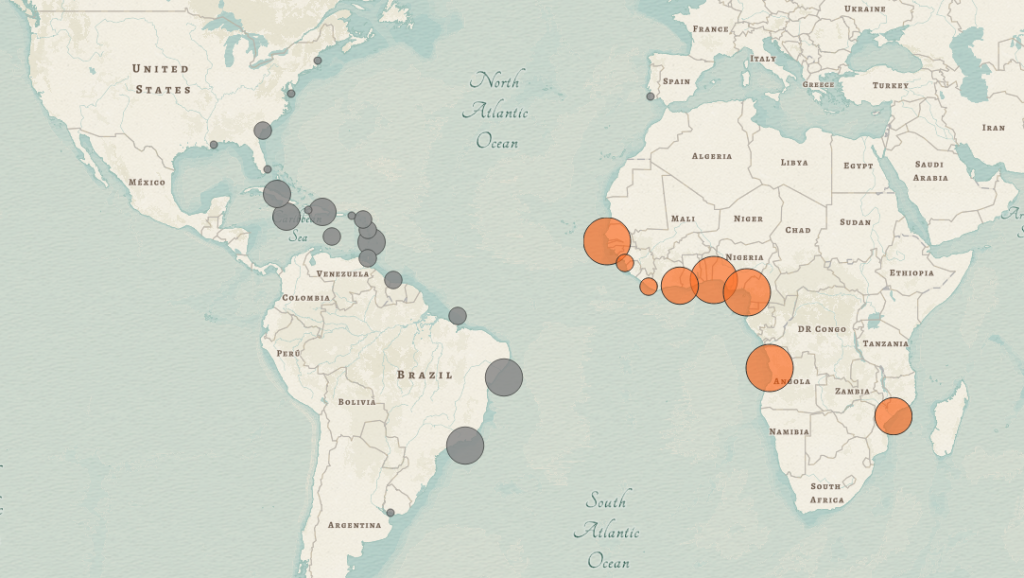
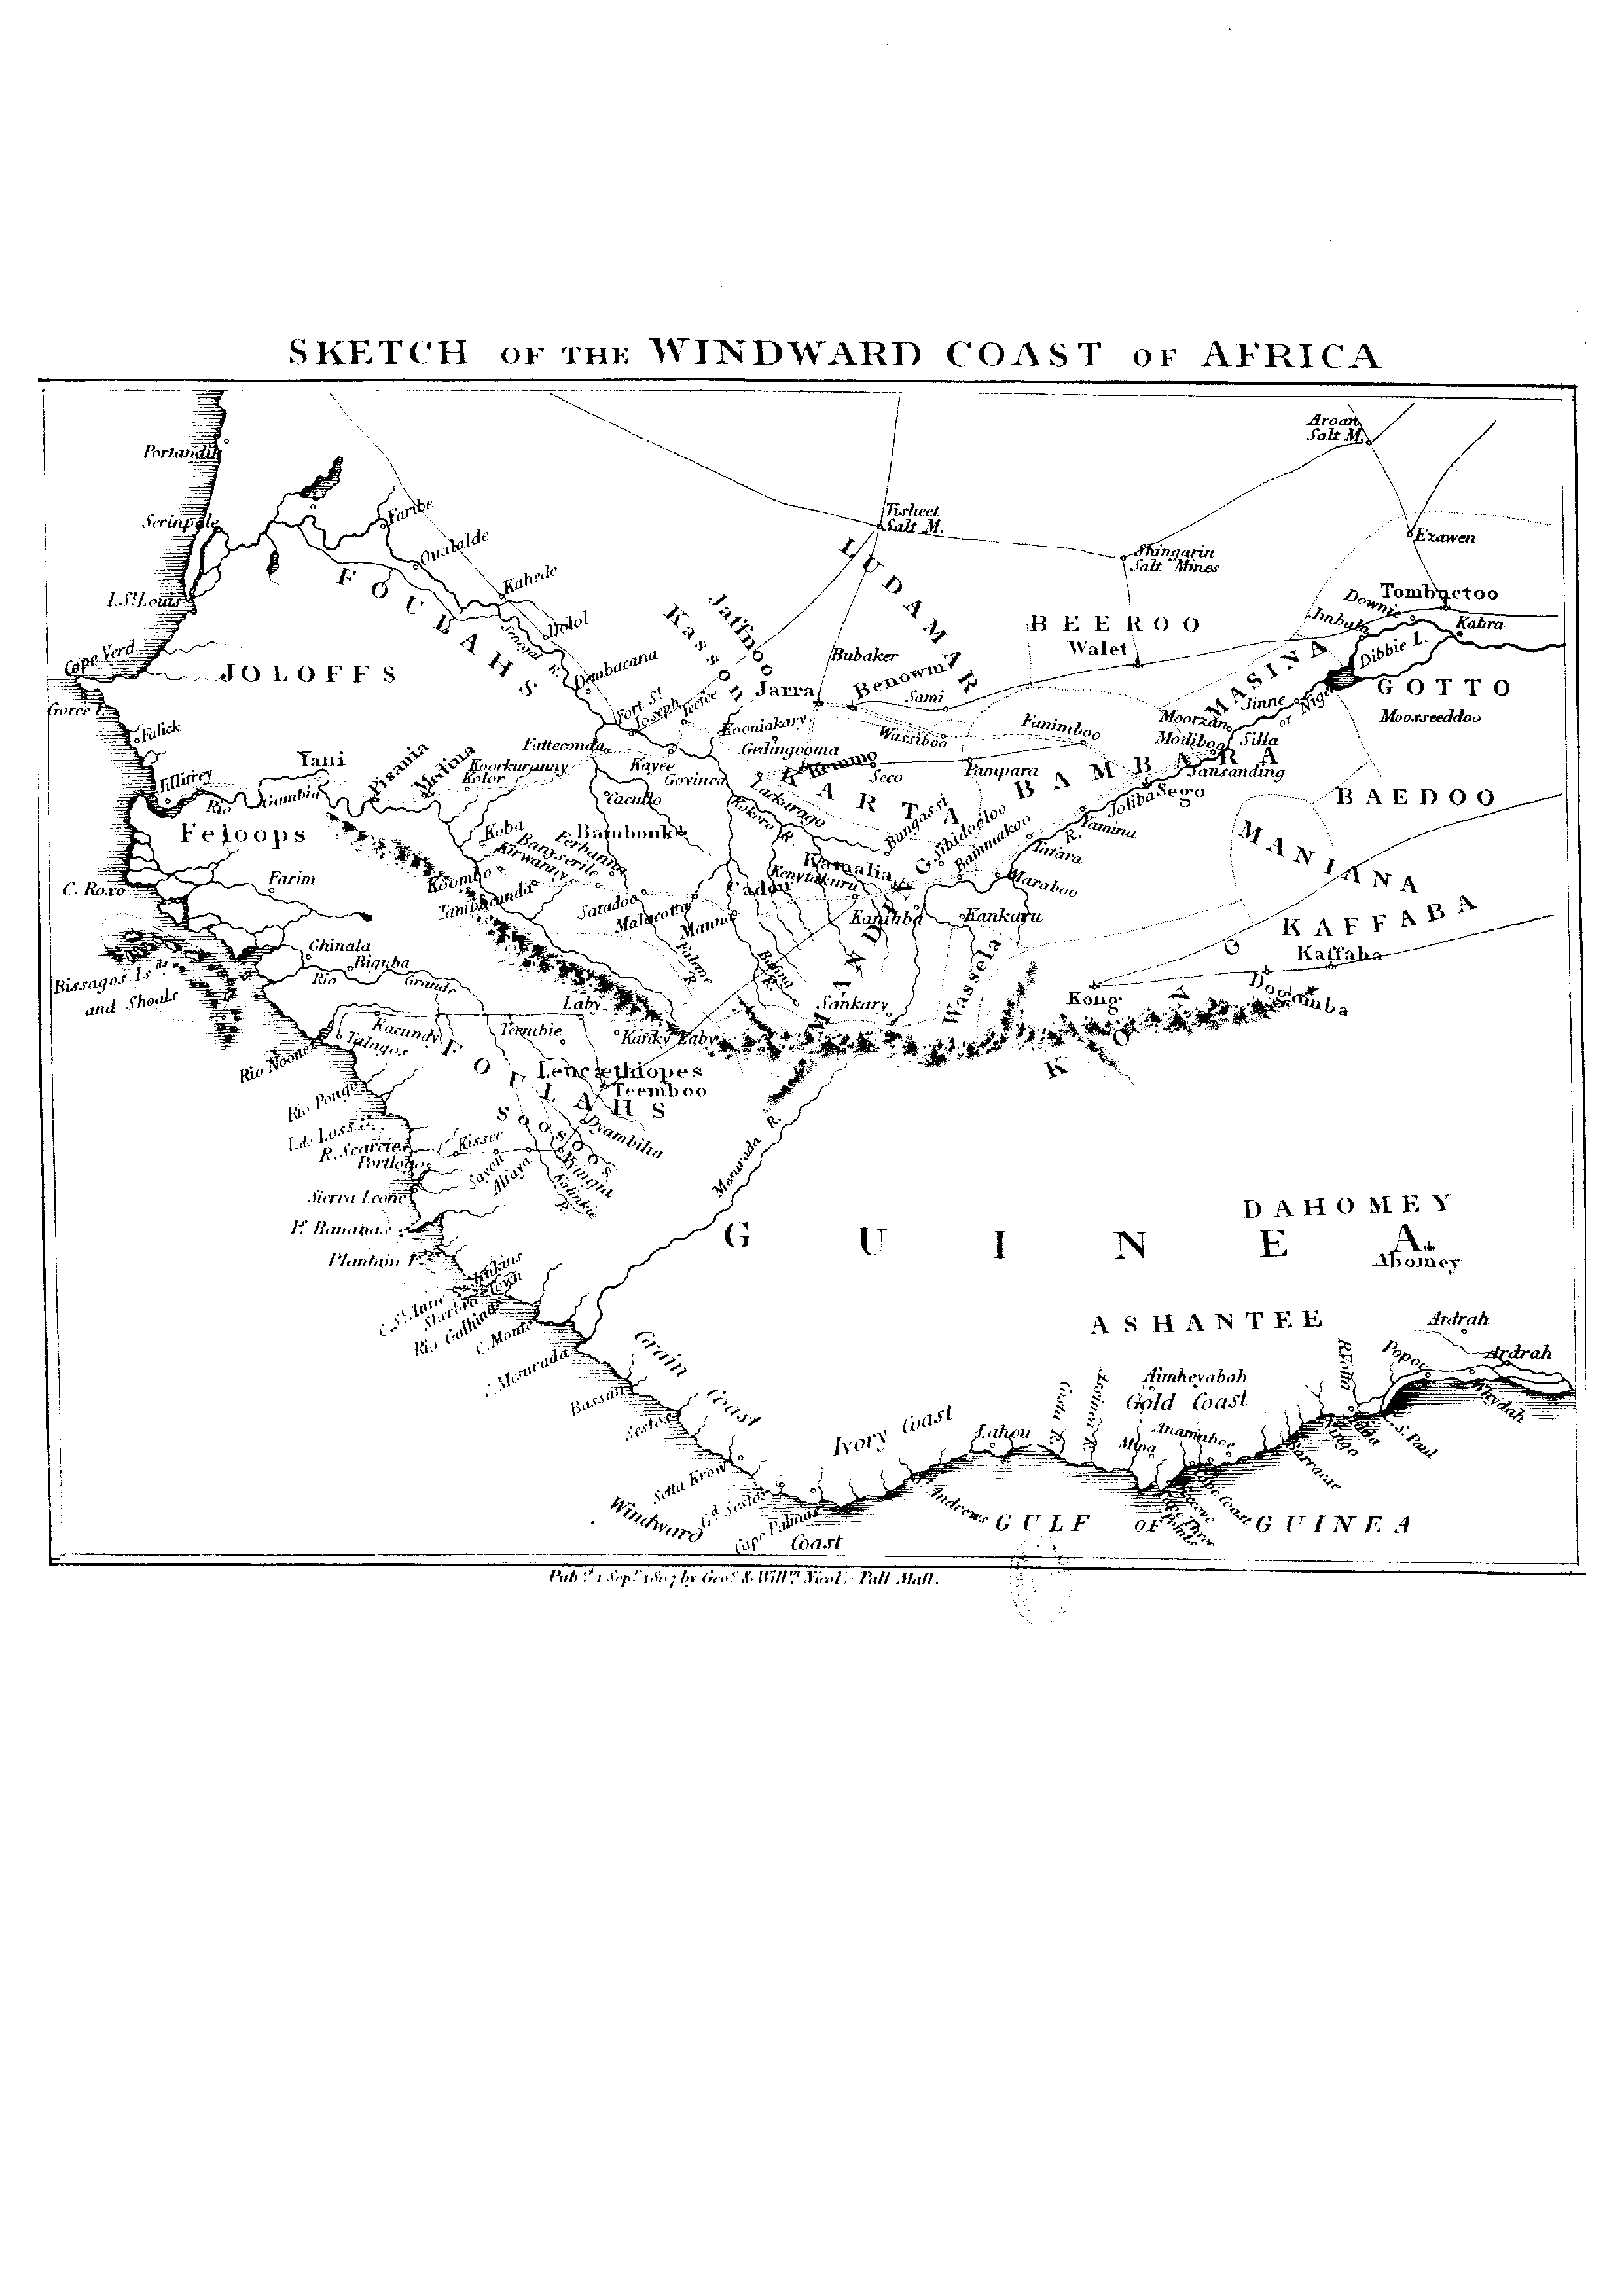
From The Trans-Atlantic Slave Trade (16th – 19th Century)
Week Seven –10/8-10/10
Background on Torn Apart (read this before you look at the maps below)
Example projects: “Torn Apart”/Separados” and “Follow the Money”
Incidents in the Life of Harriet Jacobs – mapping against her life narrative
Holocaust Geographies Collaborative —- http://www.ushmm.org/learn/mapping-initiatives/geographies-of-the-holocaust/
Thursday (Faull away)
- Discuss Chapter 4 in Meirelles
- Examine concepts and Case Studies
- Introduce ArcGIS Online
Homework over break, read Segel and Heer, “Narrative Visualization”
Week 9 Thursday 10/17
- Discussion of Segel and Heer
- New York Times Data Journalism example
- Video of Edward Segel “How to tell stories with data”
- The importance of narrative in Data Viz–see Edge Maps
- Examples of Cultural Heritage and Digital Inquiry
- ArcGIS Online StoryMaps Gallery
- For Tuesday, watch Manuel Lima – Visual Complexity: 10 years of mapping complex networks from VISUALIZED on Vimeo.
Week 10 10/22-10/24
Tuesday
Intro to ArcGIS Online
Thursday
Guest talk
Associate Professor of North American History and Civilization, Dept. of Anglophone Studies (Université Paris 8), Anne-Claire Faucquez will talk about her work in lower Manhattan to preserve and to honor the memory of the slaves buried there. She will focus on the visual design of the museum at what is now the African Burial Ground National Monument and which has three objectives: to show the history of slavery in New York as it was practised between the 17th and 19th centuries, to tell the story of the cemetery (its location, its use by slaves in the city, how it was forgotten and then rediscovered), and to highlight the battles that took place between New York’s African American community and the city’s authorities over the development of this memorialization project.
Week 11 10/29–10/31
Tuesday
StoryMaps and Arc GIS online–Janine Glathar, GIS expert

Thursday
- How do we understand networks?
- Network visualization with Gephi
- Instructions for Gephi (using preloaded file)
- Should I use networks for my data?
Week 12 11/5-11/7
- Gephi workshop
- Index of Complex Networks
- Gephi Github datasets
- African Names Database-Faull’s subset for Gephi
Syntax of New Language?
Read Shawn Graham, Network Analysis and Networks in Practice
Week 13 11/12–11/14
- Gephi work
- African Names Database work
- Assignment 5 — submission date 9 AM 11/19
Week 14 11/19-11-21
Ken’s questions
Ken Flerlage returns for Tableau
Final Project work
Final project prep
Week 15 12/ 3–12/5
Final Project work
Week 16 12/10
Final presentations
