The platform Gephi took home the first place trophy with being one of the most frustrating and difficult data visualization programs that I have ever worked with. It began with the Gephi 9.2 download not working on my computer and took nearly a week for me to figure out what I needed to do. This task involved the download of Gephi 9.1 along with the installation of Java. Also, due to the fact that Gephi 9.1 is different than Gephi 9.2, the quick tutorial was most certainly not quick resulting in the frequent urge to defenestrate the computer out the window, however, I must note that this did not happen. Upon Gephi beginning to function properly, I began to use the pre-made data sheets so that I could become somewhat familiar with the operations such as the Les Miserables and the Southern Ladies sheets. These data samples served as good practice, to say the least, and from there I thought I would try the challenge of creating my own. This was certainly for me was a challenge due to the fact that I am not super handy with Microsoft Excel and Gephi 9.1 is a tad quirkier than Gephi 9.2.
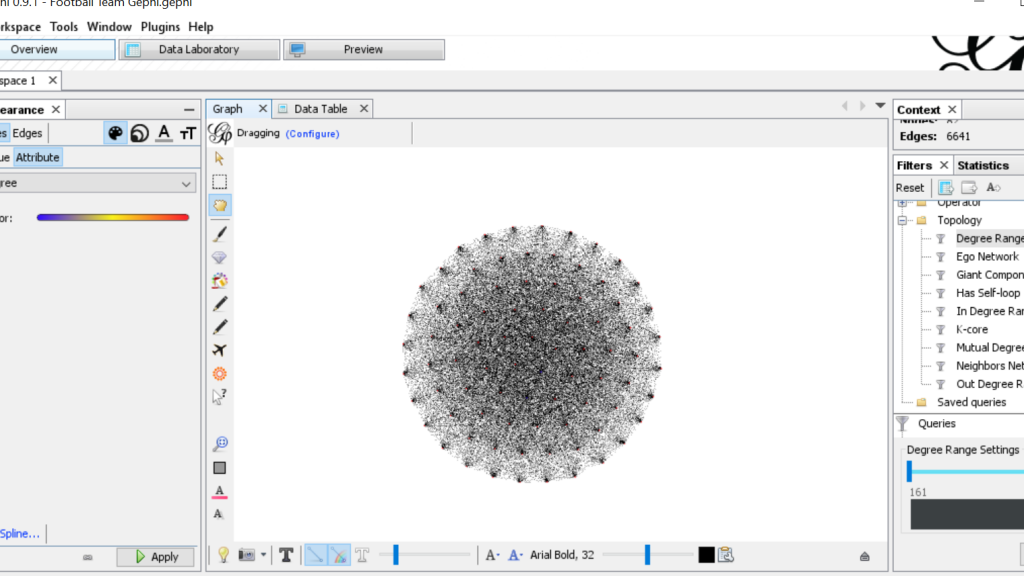
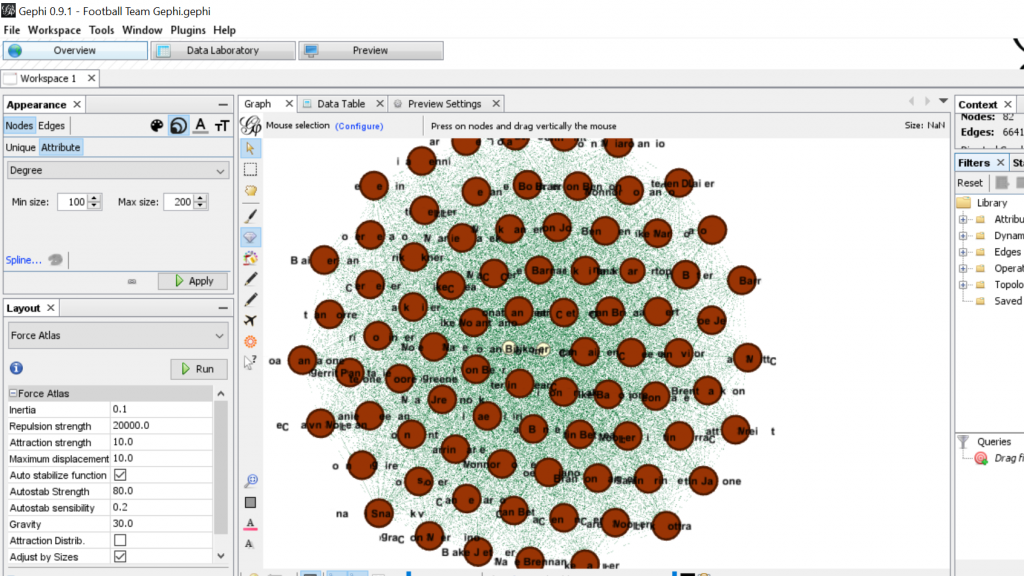
For my Gephi work, I thought it would be appropriate to make my own data sheets in Excel and then import the sheets into Gephi. This creating of the sheets was quite tedious. However, once the data was entered into Gephi the work could begin. I began with the Layout tab and implemented the force-directed layout. According to Graham the force-directed layout, “…attempt to reduce the number of edges that cross one another while simultaneously bringing more directly-connected nodes closer together” (Graham 249). This is visible from the initial visualization to the next visualization illustrated in my screenshot. It greatly reduced the number of edges that were present. Also, some of the key nodes are greatly made more visible which in this case is the members of the football team. This closely coincides with another point that Graham makes when speaking of another analysis when stating, “…noticing immediately some central players in the art world: a few famous dealers, some museums, and so forth” (Graham 252). When looking at this visualization in Gephi it can also be quite complex in nature especially when considering the amount of interconnectedness among the football team. However, according to Manuel Lima when examining these complex visualizations that possess this unity, “…the unaccountable interacting variables and inherent complexity that makes us gaze in awe when contemplating such a landscape…” (Lima 231). And, in the case of the football team visualization in Gephi with the many edges connecting the numerous nodes as in the second screenshot, “…the dense layering of lines and interconnections might enthrall us at a deeper level, leaving us to marvel at the feeling of wholeness from disparate multiplicity” (Lima 231). Which most certainly applies to the visualization of the football team created in Gephi. It is also important to note that Lima later speaks of the notion of diversity in unity this phenomena certainly applies to the visualization that I have created using the Gephi platform.
