Lima’s Chapter Two discusses the transition from trees to networks in the world of data visualization. He describes network visualization as an “ubiquitous data sphere,” containing tangled networks of nodes and links, representing huge volumes of data while using optimal screen space. Networks are an omnipresent structure, symbolizing data as a non-hierarchical autonomy, almost as an art of multidimensional behaviors from which we can reveal new knowledge and patterns as well as abstract new meanings
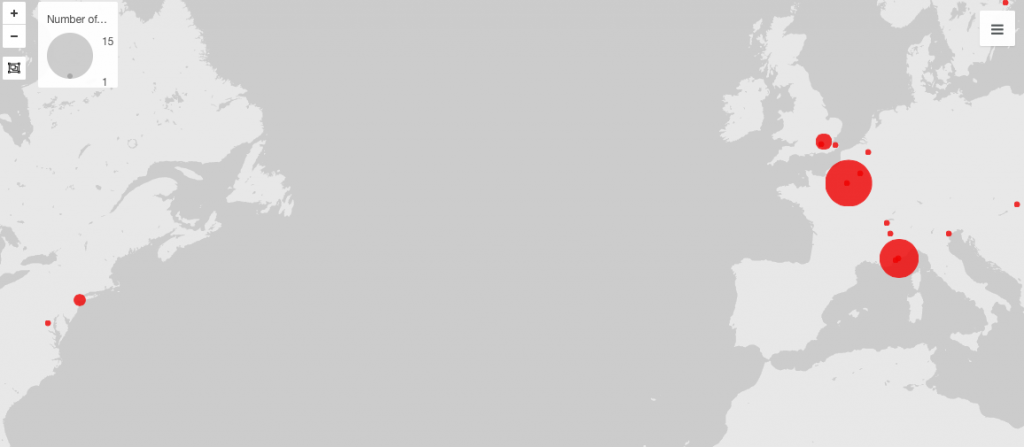
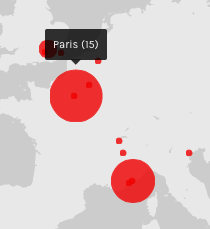
I used the sample data set in Palladio to analyze a set of relations on the names in the data set based on the place of death according to the number of people that died at those locations. I added a point-based map layer from the data, focusing on place of death. Through my visualizations, I found that more deaths occurred in Paris, Moraco, New York, and London than in any other locations in the set. This conclusion was drawn from the bigger node sizes on those locations, due to my size points being based on number of people. The visualization allows the viewer to hover over each node, and a tool top then indicates how many people from the data have died in that location. Examples are included below.


Furthermore, space and time are two significant concepts in the digital humanities. Meirelles writes that our concepts and corresponding visuals are organized around the difference between linear and cyclical times. Linear times can be visualized with timelines, typically represent historical time. Timelines contain chronological and sequential narratives of historical events, using space to communicate temporal distance through intervals. By mapping time and events in this uniform way, it enables viewers to make an easy comparison of time intervals. In the digital humanities, digital timelines enable navigation through time by means of sliding back and forth along the structure. Inclusion of historical context and the ability to filter data by certain thresholds makes digital timelines an effective, sometimes detailed method for representing events over time.
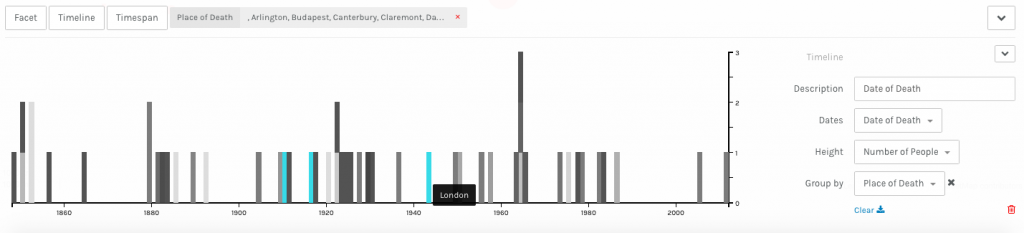
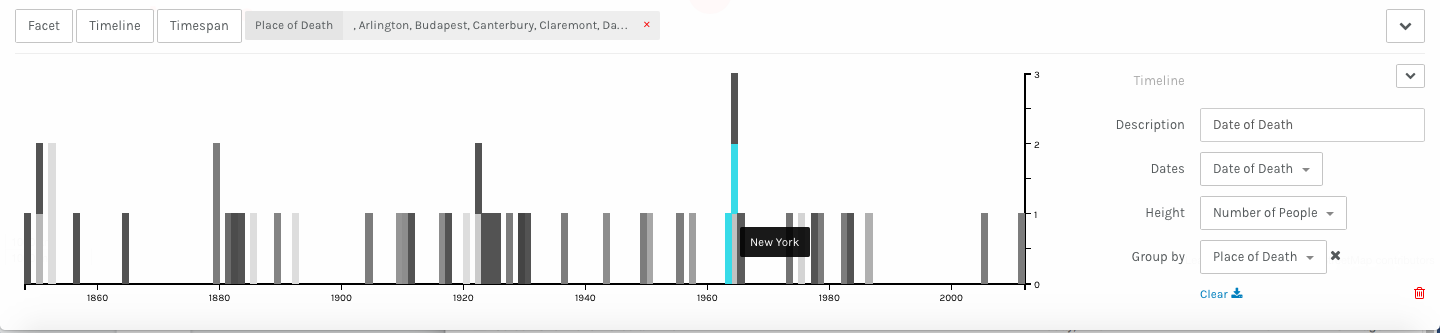
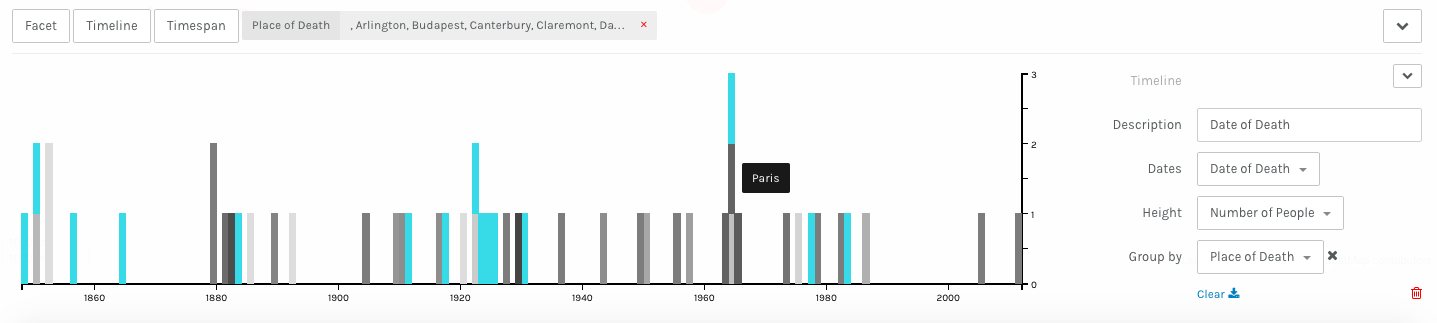
I then used Palladio’s timeline tool to create a representation of date of death’s according to the number of people, grouped by place of death. This created an easy-to-read, interactive visualization that allowed for me to gain knowledge of numbers of deaths in each country during certain time periods according to the data set. Taller bars correspond with a greater amount of deaths and by hovering over each bar, it highlights and indicates which country is being focused on. Below, I have inserted a timeline screenshots focusing on London, New York, and Paris to demonstrate this portrayal.
Timeline JS
Timeline JS is an open-source tool that enables anyone to build visually rich, interactive timelines. Creating a timeline with this program can be as simple as using a Google spreadsheet. After doing some research, I decided to use Timeline JS to hone in on three significant events that occurred in London, New York, and Paris that may have caused an increased death count and node size at certain times. The timeline is embedded above so that viewers can interact with and grasp an understanding of the events at hand, and consider possible reasons for death rates in certain countries at indicated times in the data set.
Johanna Drucker
The means by which a graphic produces meaning is known as graphical expression. Drucker (2016) emphasizes that knowing how to read visualizations as graphical expression is crucial. One particular form of graphical information is the columnar form of the spreadsheet. Discrete boxes and the grouping of data through columns allows for a meaningful result. For this assignment we used data organized by cells, rows, and columns in a spreadsheet to generate visualizations from which we can document a system of relations to create meaning.
Additionally, Drucker argues that “almost all information visualizations are reifications or mis-information.” I agree with her claim, as I believe that visualizations are representations that seem like presentations. Viewers are often presented with a situation that is further removed from the original work. Therefore, I feel the visualizations that I created with Palladio are representations, rather than knowledge generators, of the data sample that I chose to use. They are generated using only the specific data in the provided sample, with no outside knowledge. However, the viewer can draw conclusions, similar to the ones in this post. In that case, viewers can generate their own knowledge from the visualization, similar to how I used destructive historical events to justify higher death rates in London, New York, and Paris.