I used Tableau to analyze the African Slave Names database and the US Slavery in the 1860s data and Voyant to analyze the Slave Narratives. When initially interacting with the data sets to get a better sense of what the information was about and to better understand the two platforms, I became very interested in the differences between men and women. Specifically, I wanted to get a sense of what it was like to be a woman during the 1800s. I began looking into trends and finding patterns which helped me focus my development of the data.
What caught my eye when looking at the raw Slave Narratives was that both Nat Turner and Phillis Wheatley had their narratives published within three years of each other. I felt that focusing on these two particular narratives would be beneficial in evaluating the differences between men and women because Phillis Wheatley was a woman and Nat Turner was a man and they would be easily comparable given how close the publication dates were to each other.
The above Cirrus reflects the most common words in Phillis Wheatley’s Narrative.
The below Cirrus illustrates the most frequently used words in Nat Turner’s Narrative.
The below illustration depicts the most frequently used words in both narratives as well as the most unique words in each individual narrative.
In Voyant, I first created two wordclouds and put them side by side to one another with the bottom one reflecting Nat Turner’s narrative and the top one illustrating Phillis Wheatley’s narrative. I learned right away that in the wordcloud, size matters. The size of the text is a proportional representation of number of words in the corpus. By looking at the cirruses alongside the summary of frequent and distinctive words, I was able to see that the word “death” appeared frequently in both narratives. Given the state of the country at the time and the terrible conditions both Wheatley and Turner faced, I am not surprised to see how prevalent the word “death” was. On the other hand, it was interesting to me that the word “blood” was used often in Turner’s narrative, but not in Wheatley’s. I continued to question how gender roles played into this result and thought about how Wheatley, as a woman, could have had more of a passive role in the fight against slavery. I kept this in the back of my mind as I continued to explore the data set.
However, what was most interesting to me was when I looked at the most distinctive words in each corpus because I feel that it provided me with insight into the gender differences that occurred. In the Wheatley narrative, the words “heavenly” and “skies” were most unique. After looking at other narratives from other female slaves which were published around the same time period, such as Bethany Veney, I noticed that the female slaves, in particular, relied heavily on religion to get them through the difficult times. They spent a lot of time hoping and praying for freedom and for better days in the future. The women seemed to have more of a positive outlook on the situation than their male counterparts. The comparison of Wheatley’s narrative to Turner’s narrative further affirms this theory as the distinct words in his narrative were “party” and “southampton.” These words are also significant because Turner took a very active role in the fight against slavery. He led a gory rebellion against white people which took place in southampton. He took a much more active role than Wheatley in the fight against slavery which made me consider the stereotype that women are supposed to be more passive and take a more submissive role.
I further investigated my theory of the prevalence of hope in the women’s narrative by comparing the usage of the words “god,” “hope,” and “love” in Wheatley’s narrative to Turner’s narrative. The above visualization reveals my findings. Like I previously suspected, these positive words that I selected are found in Wheatley’s narrative 101 times compared to Turner’s 8 times. This difference is significant and really makes me wonder how much gender stereotypes have played into this.
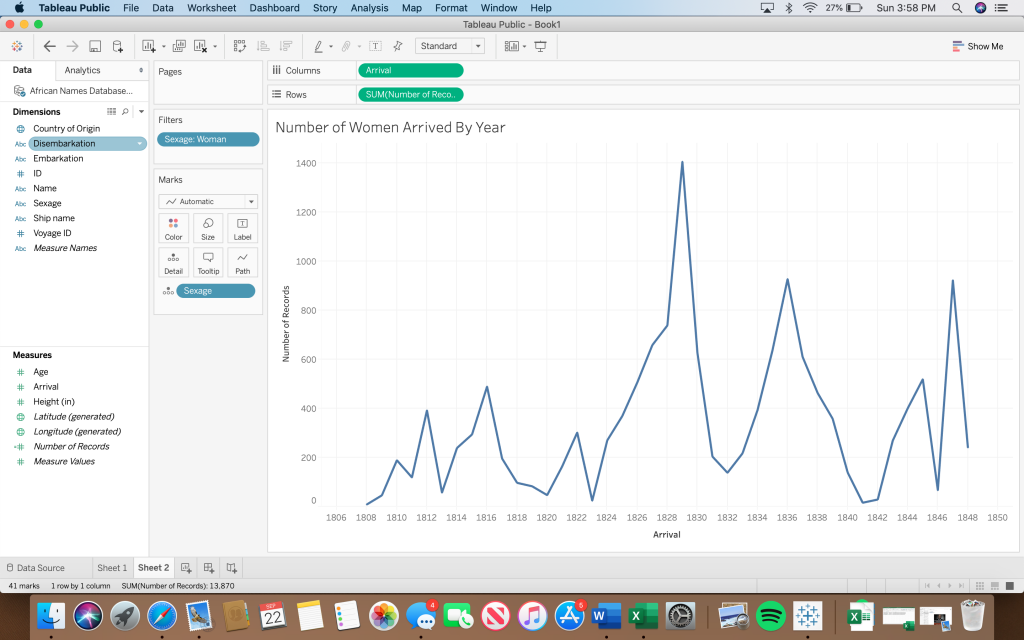
I continued to look at the trends involving gender when I analyzed the African Slave Names Database and US Slavery in the 1860s data using Tableau. I decided to plot the number of women slaves who arrived in the US by the year in which they arrived. I noticed that 1829 was the year when the most number of women were brought over. To get a historical context for this, I researched significant events that occurred during 1829 in US history. I discovered that this was the year when “David Walker of Boston publishes his fiery denunciation of slavery and racism, Walker’s Appeal in Four Articles. Walker’s Appeal, arguably the most radical of all anti-slavery documents” (US History). Immediately following 1829, the number of women slaves coming to the US started rapidly declining, which makes me believe that Walker’s work had a strong impact on society. This event is also significant because Walker is from Boston, which is where Wheatley lived after being brought to the US. Around thirty-five years after her death, a movement against slavery began close to where she lived. How come Wheatley was unable to have the same success as Walker? Could it be because more time had passed or is it because Wheatley, as a women, was not taken seriously by society? This process of working with the data sets and analyzing them from different perspectives allowed me to consider these reasonings that I would never had even considered if I was just presented with the raw data.
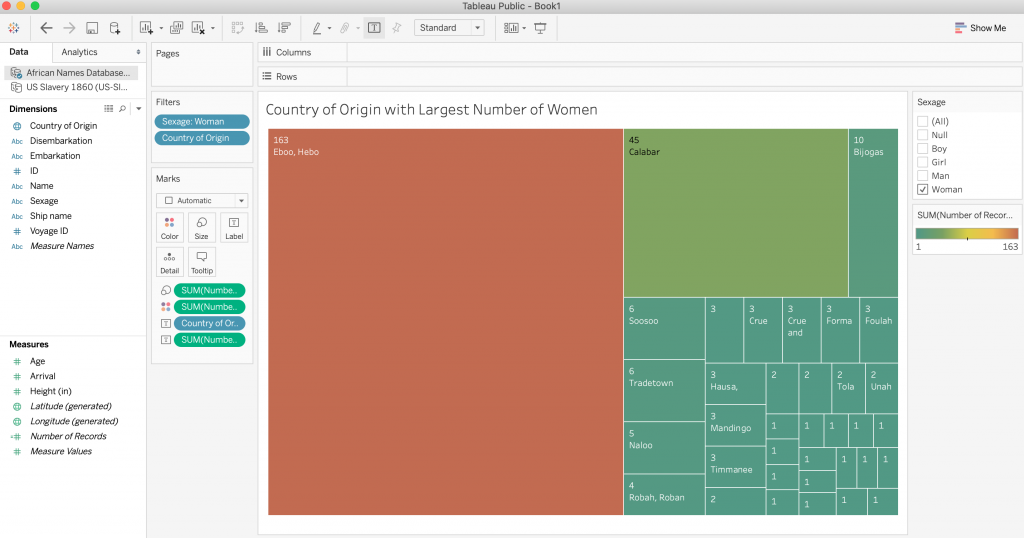
I wanted to find the country where the most women came from using the African Names Database. I sorted the data so that only the records of women showed and I was surprised at how much of an imbalance I found in the result and how much of a lack of information there was. I found that 163 women came from the country Eboo, Hebo, but I could not find anything about this online. In fact, nothing came up when I searched it. This process of analyzing the data exposed biases in data collection and how populations of people are just unaccounted for. The next country to have the largest amount of women was Calabar. 43 of the women in the database came from there. This is interesting to me that such a large percentage of the recorded women came from one country.
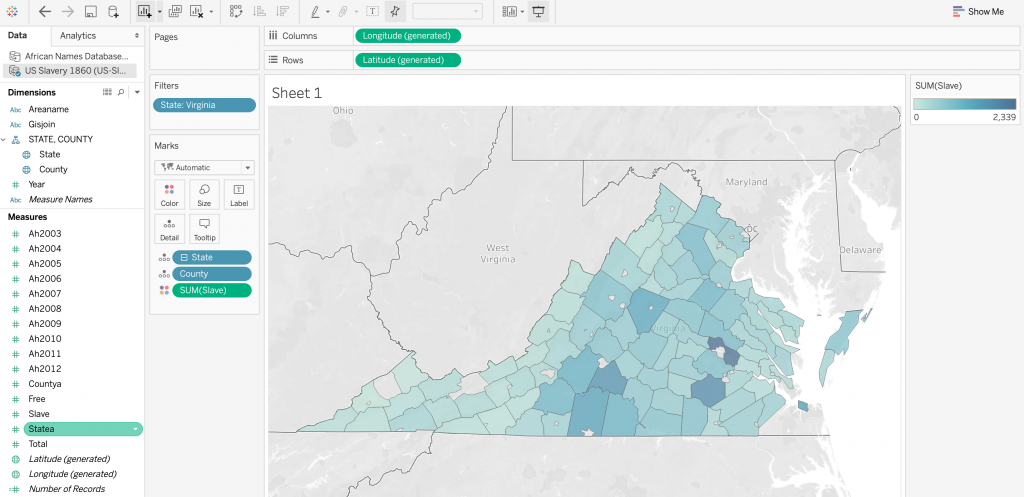
I then decided to pivot a little bit and look into the state of Virginia, where Nat Turner lived after being brought to the US. As illustrated in the visualization below, almost thirty years after his death, slavery was still extremely prevalent in the state of Virginia. The visualization depicts the state of Virginia and the darker colors represent the counties with the largest amount of slaves in the population. Despite Turner’s anti-slavery efforts, the issue remained very apparent even years later.
After working with both Voyant and Tableau, I believe that I got a better sense of what each platform is like and when it is most beneficial to use. Tableau allows me to work with quantitative data sets and present the findings in visually appealing ways. Voyant, allows me to do the same thing, but with qualitative data instead. As discussed in the Faull reading, Voyant “allows for the ‘algorithmic’ reading of literary language, and serves as an entry point into the field of computational and corpus-based linguistic analysis of literary texts” (Faull 4). To me, the most beneficial thing about Voyant is that it provides keywords and contexts in the corpus. It allowed me to take the large narratives filled with huge volumes of text and figure out the main themes and concepts of them without having to read every word. Furthermore, it allowed me to compare the narratives with one another and find similarities and differences in a matter of seconds. Specifically, this was most beneficial when I compared Wheatley’s narrative to Turner’s. I was able to see what the differences in life of Wheatley and Turner were and was able to compare their specific narratives to historical trends to draw conclusions. Tableau was helpful to me because I was able to interact with the two large data files and compare specific elements of each in a creative, aesthetically pleasing way. I found the “show me” tab to be really helpful in getting started with the creation of my visualizations. However, I encountered problems when I tried to put certain dimensions/measurements into a specific column or row and it would not let me. As I began to use the platform more, I became more familiar with it, but still had some difficulty. Tableau helped me illustrate the distribution of slaves in the US on a map, which makes it much easier to the viewer. Instead of having to go through a large excel file, I was able to manipulate the data to produce the outcome I wanted. Both platforms are similar in that they allowed me to go through large sets of data (whether that was qualitative or quantitative) and discover the answers to my questions without having to analyze every single word/number.
Both Tableau and Voyant allowed me to practice the concept of “differential reading” discussed by Tanya Clement. This process of corpus construction and creation of iterative visualizations allowed me to identify features I might not have seen, “make hypotheses, generate research questions, and figure out prevalent patterns and how to read them” (Clements). Voyant, in particular, allowed me to realize how texts differed from one another and how they related. I was able to find patterns and relationships among the data sets. Furthermore, like we discussed in class, this process has allowed me to see the complexities of gender and race. I was able to see the big picture of the data in front of me and get additional “data points” that I would not have seen or have collected without embarking on this process. I was able to get a more holistic representation of society and breakdown any previous misconceptions I had. Utilizing Voyant and Tableau allowed me to synthesize things to make a multi-dimensional, authentic viewpoint.
