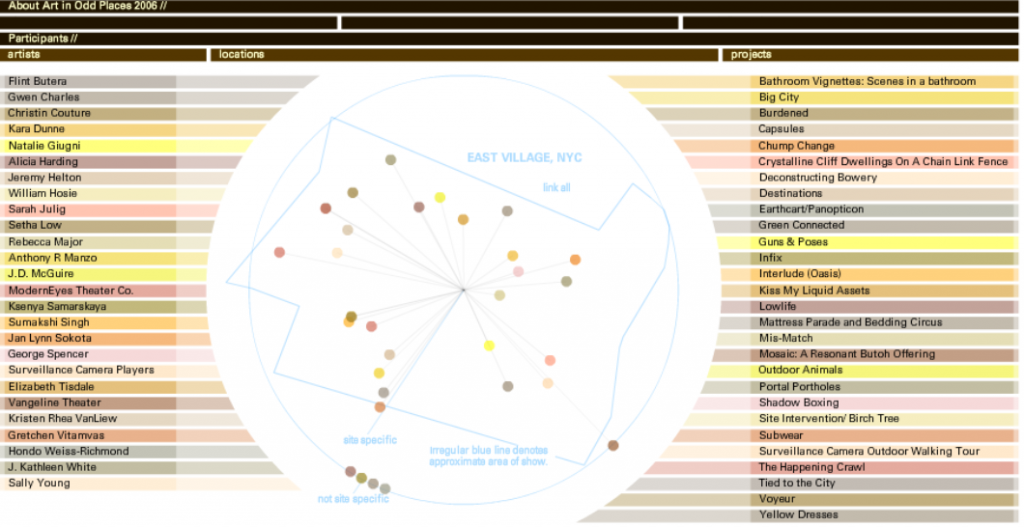
David Bunde created this visualization so that artists of the Lower East Side in Manhattan may have the chance to explore the role public space plays in society in terms of authors displaying their projects. I was drawn to this visualization because i live in close proximity to the location-at-hand. Viewers, specifically artists, can interact with the visualization in a way that allows them to examine and understand the relationships between creators, locations, and projects through three corresponding columns. The method the author used to connect each aspect of the visualization to one another enables the viewer to see the information they want very easily. The visualization exemplifies the concept of a dynamic visualization in many ways. Firstly, one can interact by hovering over any listed artists’ name, any location, or any project and see its connection to the other nodes. Lima described the world wide web as a “Tangled network of nodes and links, embodying an enormous volume of data” (Lima 56). Bunde uses artists names, locations in the East Village, and project names as nodes and links them together through the interactive visualization. In these ways, we can interact with and grasp an understanding of the material.
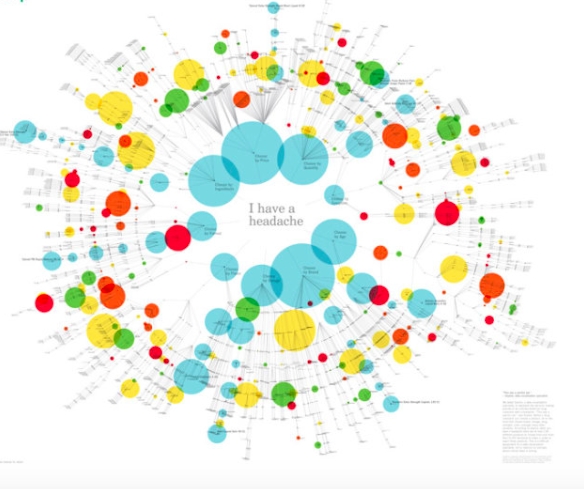
The unknown author created this visualization to illustrate an array of over-the-counter drugs available for headaches. What drew me to this piece were the bright colors used for nodes as well as the branches from a central foundation. Being a network, it displays the many decision making processes one may go through to choose a brand of medication. It uses branches, similar to those of a tree graph discussed in class, to radiate from the central headache and “branch off” into a chain of decisions. In chapter one, when discussing tree graphs, Meirelles writes that “In a nutshell, hierarchical systems are ordered sets where elements and/or subsets are organized in a given relationship to one another, both among themselves and within the whole” (Merielles 17). Suggested medications in the visual are related to factors like age, brand, dosage, etc. Although this work is not interactive, it still provides the viewer with a chart packed with hypothetical choices one may face. I feel that if the author made this visual interactive and available to be viewed from different perspectives, it would be much more useful for the people interested. Furthermore, it would contribute to new ways of understanding the material.
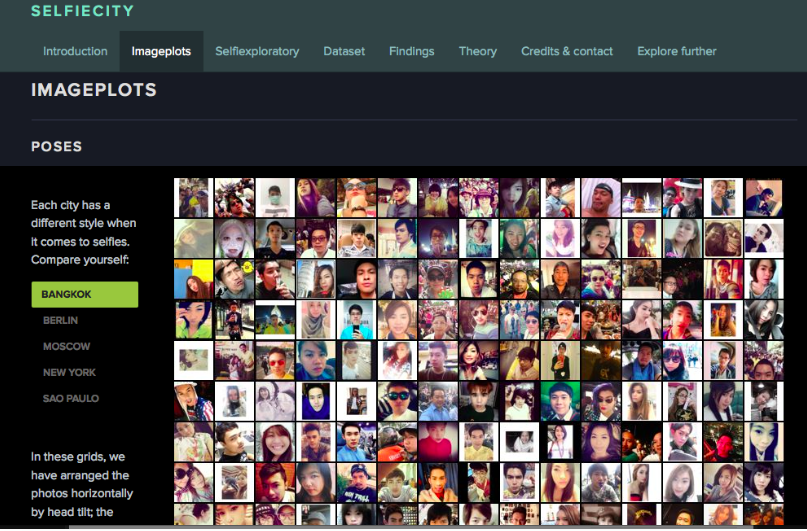
“Selfiecity” is an interactive visualization that illustrates different themes and trend in the selfies people from all around the world take. I chose to examine it because in today’s world, social media as well as selfies are a very prominent part of society. Du Bois describes data visualization in his Visualizing Black America as, “the rendering of information in a visual format to help communicate data while also generating new patterns and knowledge through the act of visualization itself” (DuBois 8). The visualization is definitely very organized, allowing for the viewer to easily explore and find patterns in data sets. The use of image plots helps display and categorize the pictures. Categories of the images include types of selfies and different poses. It even includes and compares selfies from different cities, ages, and genders. Viewers can easily access and see the data without drawing bias from it. Additionally, it builds on our understanding of the subject with easy-to-read graphs and theoretical essays.
The visualization utilizes both quantitative and qualitative metrics to allow for multiple perspective to be taken into account. This use of dynamic data gives viewers the opportunity to interact with and know the data.
Although it is a very well-constructed visualization, I did find a privacy issue in that the authors didn’t ask permission to use the pictures in their study. This is a common ethical problem in research and case findings. In addition, the authors may not have accounted for all selfies. Most times, there are populations of people who fail to be represented in data samples due to biases or simply not being on social media.
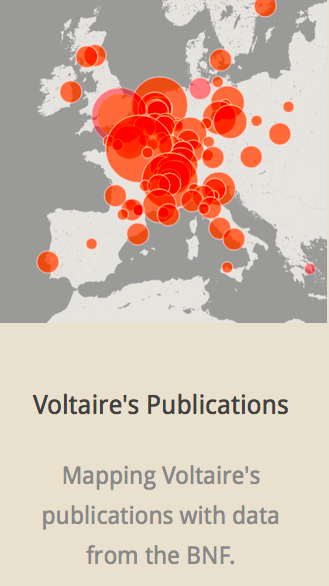
The Mapping of the Republic of Letters uses visualization to display Voltaire’s correspondence of networks across continents and further the understanding of his connections to certain people and places. Networks included were social networks created by scientific academies and physical networks created by travel. I feel this is a well- developed, interactive work that answers questions people may have regarding these networks. The method used to present the data allows for viewers to interpret and draw their own conclusions from a multi-dimensional perspective. This dynamic method eliminates any possibility of bias from the author in the visualization due to direct manipulation of the graphical objects and statistical properties.
