Data literacy is important in all aspects of our world. It presents to people statistics, world issues, navigation, and so much more. It provides us with data that can be applied to real- world problems, whether it be in health, inequality, the economy, or the environment. Data visualization renders information in a way that helps communicate the data to the people. However, data ethics are of utmost importance. Bias, accountability and transparency are common issues in data ethics. Withholding bias in certain areas of research can lead to accountability and transparency for all races, genders, and social groups. This can lead to the design of data sets and systems that work towards equality and fairness. Du Bois was an important figure in the beginning of date literacy and visualization. He led his students to collect and analyze data on black communities so that they may think sociologically and go on to compile charts and graphs based on their findings. These charts and graphs could then be used to analyze experiences of black people, especially in Philly, around the beginning of the twentieth century. Their findings showed that black population and fertility rates were increasing.
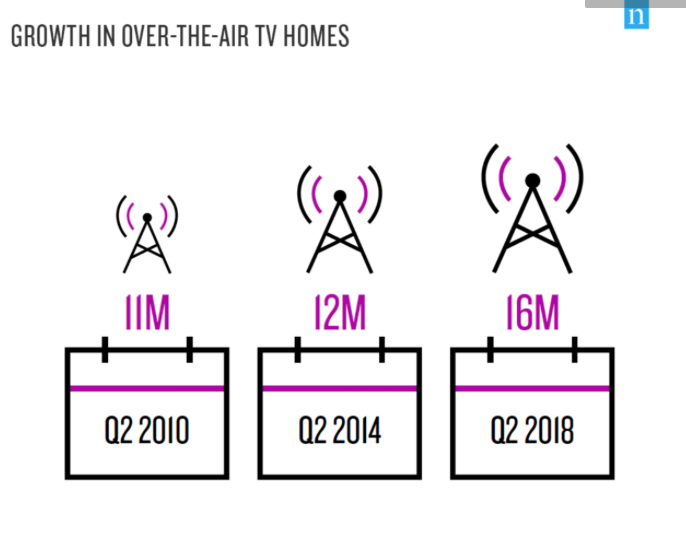
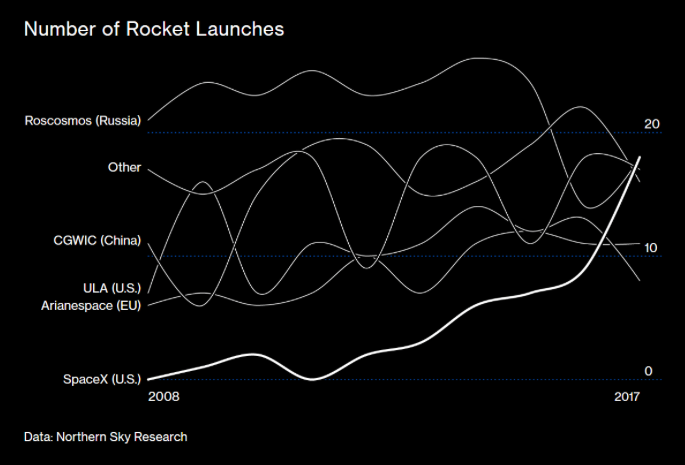
The following examples from viz.wtf portray misuses of data visualization.